

Charter Communications stock is probably one of the most out of favor stocks in the market right now and it is currently priced at a meager 3.5x trailing twelve months price to earnings ratio and 3.3x price to free cash flow. Charter shares are down roughly 67% over the last year and currently trade near a 12-year low.
Why is Charter so cheap?
This is the question that every value investor must ask when looking at a value investment opportunity. Is Charter a value trap or is the market overreacting to competitive threats from fiber and fixed wireless technology?

The goal of this article is to answer those questions and provide an overview of Charter and its competitive position.
In 2025, Charter generated about $22.7 billion of annual adjusted EBITDA and serves over 30 million broadband customers in the US. For some perspective, Charter’s current market cap is only $16.36 billion, or $129 per share.
Despite Charter’s strong and stable earnings power, the stock trades at valuation multiples more commonly associated with businesses in permanent decline. Investors appear increasingly concerned that fiber broadband and fixed wireless access will gradually erode Charter’s customer base and profitability over time. I believe these fears are overblown.
At first glance, those concerns appear reasonable. Broadband subscriber growth has stalled, competition has intensified, and Charter carries a significant debt load.
However, after spending considerable time studying the economics of broadband competition, I believe the market may be extrapolating the economics of the most competitive markets across Charter’s entire footprint.
The key question is not whether fiber is a superior technology. It almost certainly is. The more important question is whether fiber competition will permanently impair Charter’s ability to generate attractive returns on its network infrastructure and invested capital.
The Cox Acquisition
Charter and Cox Communications agreed to merge in May of last year.
The combined Charter/Cox company will possess greater scale, broader geographic reach, and meaningful cost synergy opportunities. Management has guided to substantial run-rate synergies ($500 - $800 million), and history suggests that large cable operators often realize benefits beyond initial estimates.
The transaction will increase leverage in the near term, but it may also strengthen Charter’s competitive position over the long term.
The FCC has already approved the merger, and it is expected to close in the next 1 - 3 months.
Why Charter Stock Is Cheap
Investors appear concerned about four primary issues:
Fiber overbuild competition.
Fixed wireless competition.
High financial leverage.
Broadband subscriber losses.
These concerns are legitimate and should not be dismissed. However, I believe the market may be overestimating the long-term impact of these competitive threats while underestimating the durability of Charter’s broadband franchise, the potential contribution from mobile, and the company’s future free cash flow generation.
Rather than viewing Charter as a declining broadband provider, I believe investors should view it as a mature infrastructure business with recurring revenues, substantial pricing power, and significant embedded operating leverage.
Understanding the Bear Case
The bear case is fairly straightforward. Fiber offers faster speeds, lower latency, and superior technology compared to traditional cable networks. Companies such as AT&T, Frontier, and Google Fiber continue expanding their fiber footprints, while fixed wireless offerings from Verizon and T-Mobile provide consumers with an additional alternative.
If consumers increasingly migrate to fiber networks, Charter could experience subscriber losses, pricing pressure, and declining profitability. Given the company’s leverage, even modest deterioration in operating performance could have an outsized impact on equity value.
The market appears to be pricing in some version of this outcome.
As you can see from the graphic below, Charter has lost broadband subs over the last two years in 2024 and 2025. However, broadband revenue is still growing because ARPU (average revenue per user) growth has remained positive. This would suggest that despite the recent losses in broadband subscribers, Charter still does have some pricing power.

This decline in broadband subscribers is not just affecting Charter. Comcast has experienced a similar trend, with broadband subscriber growth declining modestly in recent years while broadband revenue has remained relatively stable due to pricing power, customer mix improvements, and rising average revenue per user. This suggests that slowing subscriber growth does not necessarily translate into a proportional decline in earnings power.

Charter and Comcast are estimated to have a combined market share of roughly 65% of the US consumer fixed-broadband market.
What the Data Actually Shows
Rather than relying solely on management commentary, I wanted to understand what broadband competition looks like at the local level. Broadband economics are inherently local. A customer in Phoenix may face a very different competitive environment than a customer in Tampa or Charlotte.
Using FCC broadband maps and local market data, I examined several major Charter and Cox markets. What I found was more nuanced than the prevailing narrative.
Some markets, such as Tampa, face substantial fiber competition. However, many other markets look more like a duopoly between cable and a single fiber competitor. In Phoenix, one of Cox’s largest markets, numerous addresses showed little evidence of widespread fiber overbuild. In other markets such as Charlotte, Raleigh, and St. Louis, fiber availability was meaningful but far from universal.
AT&T has publicly disclosed that mature fiber markets achieve approximately 40% penetration, while management’s long-term target is approximately 50%. Frontier’s historical investor presentations suggest a similar range, with mature fiber markets reaching penetration levels in the low-to-mid 40% range.
This is an important distinction. Many investors appear to assume that fiber availability ultimately leads to fiber dominance. The actual evidence suggests something different: fiber often captures meaningful share without eliminating cable.
In other words, the likely end state may be a broadband duopoly rather than a winner-take-all market.
I think the market shares could look something like this in Charter’s major markets:
Charter/Cox = 40 - 45%
Fiber providers such as AT&T, Frontier, Google, and Quantum = 40 – 45%
Fixed wireless/satellite = 10 – 20%
The Hidden Value of Mobile
One aspect of the Charter story that receives less attention is Spectrum Mobile.
Charter has become one of the fastest-growing wireless providers in the United States. By leveraging its extensive Wi-Fi footprint and wholesale agreement with Verizon, the company has been able to offer attractive wireless plans while deepening customer relationships.
Charter’s mobile subscribers have grown at a compounded rate of roughly 37.7% annually over the last five years. Charter reported $3.762 billion in mobile revenue for 2025, up 22% compared to 2024.
Mobile service increases customer retention, creates cross-selling opportunities, and provides an additional avenue for growth. While broadband subscriber growth has slowed, wireless continues to gain momentum and could become a far more meaningful contributor to earnings over the next decade.
The Balance Sheet and Leverage
Charter does carry a substantial debt load with roughly $94 billion of debt, so I think of Charter as a leveraged compounder with the stock acting as a leveraged equity stub. That’s the main reason Charter is currently priced at less than 1x EBITDA.
Normally, I wouldn’t invest in a company with such a large debt load but given Charter’s market leading position (largest U.S broadband provider after Cox merger closes) and history of strong consistent earnings (average free cash flow of roughly $25 per share over the last 9 years), I am ok with the added leverage risk.
Following the Cox acquisition, I estimate net leverage will be approximately 4-4.2x EBITDA. While this is higher than I typically prefer, Charter maintains an investment-grade credit rating, generates highly recurring cash flows, and operates essential broadband infrastructure. Interest coverage remains manageable at roughly 2.6x, and management expects leverage to decline over time as EBITDA grows and capital expenditures normalize. Although the debt increases risk, I believe it is manageable given the stability of the underlying business. The debt cuts both ways. While leverage increases downside risk, it also increases the potential upside if Charter’s earnings prove more durable than the market expects. Because the equity represents a relatively small portion of the company’s overall enterprise value, even modest improvements in EBITDA, free cash flow, or valuation multiples could lead to a substantial rerating of the stock price.
The Capex Question
Another reason Charter appears inexpensive is that free cash flow is currently suppressed by elevated capital expenditures. Charter’s management team has stated many times that they believe capex will fall to around $8 billion (from ~$11.6 billion currently) after 2027. By my projection, this decrease in capex spend has the potential to add another $30 per share to Charter’s free cash flow, which would imply roughly $60 - $63 per share in free cash flow once capex returns to normal levels.
The company is investing heavily in network upgrades, rural expansion projects, and initiatives associated with DOCSIS 4.0. Management has indicated that capital expenditures should normalize over the next several years as these projects are completed.
If EBITDA remains relatively stable and capital expenditures fall as expected, free cash flow could increase significantly even without meaningful revenue growth.
Investors often focus on current earnings power while overlooking the potential impact of a lower capital intensity business several years from now.
Recent Insider Buying
One positive sign after the brutal selloff following Charter’s 1st quarter earnings report was the fact that CEO Christopher Winfrey bought roughly $1.2 million of stock in the open market. Three other Charter directors also bought roughly $2.5 million in stock after the 1st quarter earnings call. This makes me believe the insiders thought the market overreacted to the 1st quarter earnings print. It’s a good sign when insiders are buying after a negative market reaction to an earnings call.
Share Repurchases
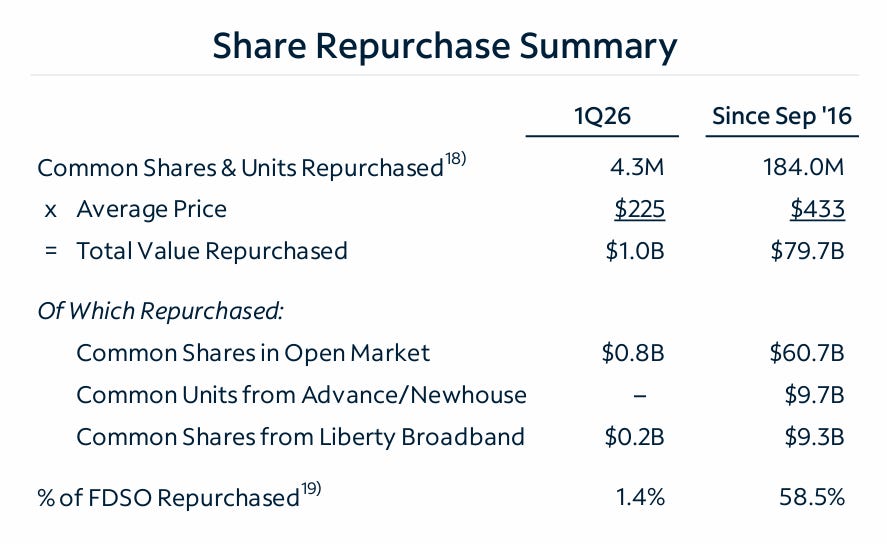
Charter has been one the more aggressive repurchasers of its own stock over the last 10 years. Since 2016, the company has bought back nearly 60% of its shares and there appears no sign it will slow down the buybacks. If Charter’s shares stay this cheap and Charter continues its aggressive buybacks, it will likely add a lot of value for shareholders. Charter repurchased 1.4% of its shares in Q1 2026. To illustrate how cheap Charter shares currently are: if the share price stayed around $130 for the rest of the year, the company could buyback roughly 22% of its shares in 2026 alone, assuming they bought back $4 billion in shares over the next 4 quarters.
Next, I’ll review what Charter’s normalized EBITDA and free cash flows could look like in a few years after the merger with Cox and provide my thoughts on what could ultimately break the investment thesis.
