

While I’m not a market forecaster and don’t attempt to time markets, I do think broad equity markets are priced aggressively by historical standards.
The ratio of total stock market value to GDP sits near an all-time high, which suggests future stock market returns are likely to be lower and drawdowns more consequential. The current stock market to GDP ratio is more than 200% and is higher than where it was at the peak of the dot com bubble.
Rather than trying to time the market, I’m positioning my portfolio to be less dependent on broad market indexes and more focused on mitigating large drawdowns — increasing cash holdings and emphasizing investments where outcomes are event-driven rather than dependent on the overall market direction.
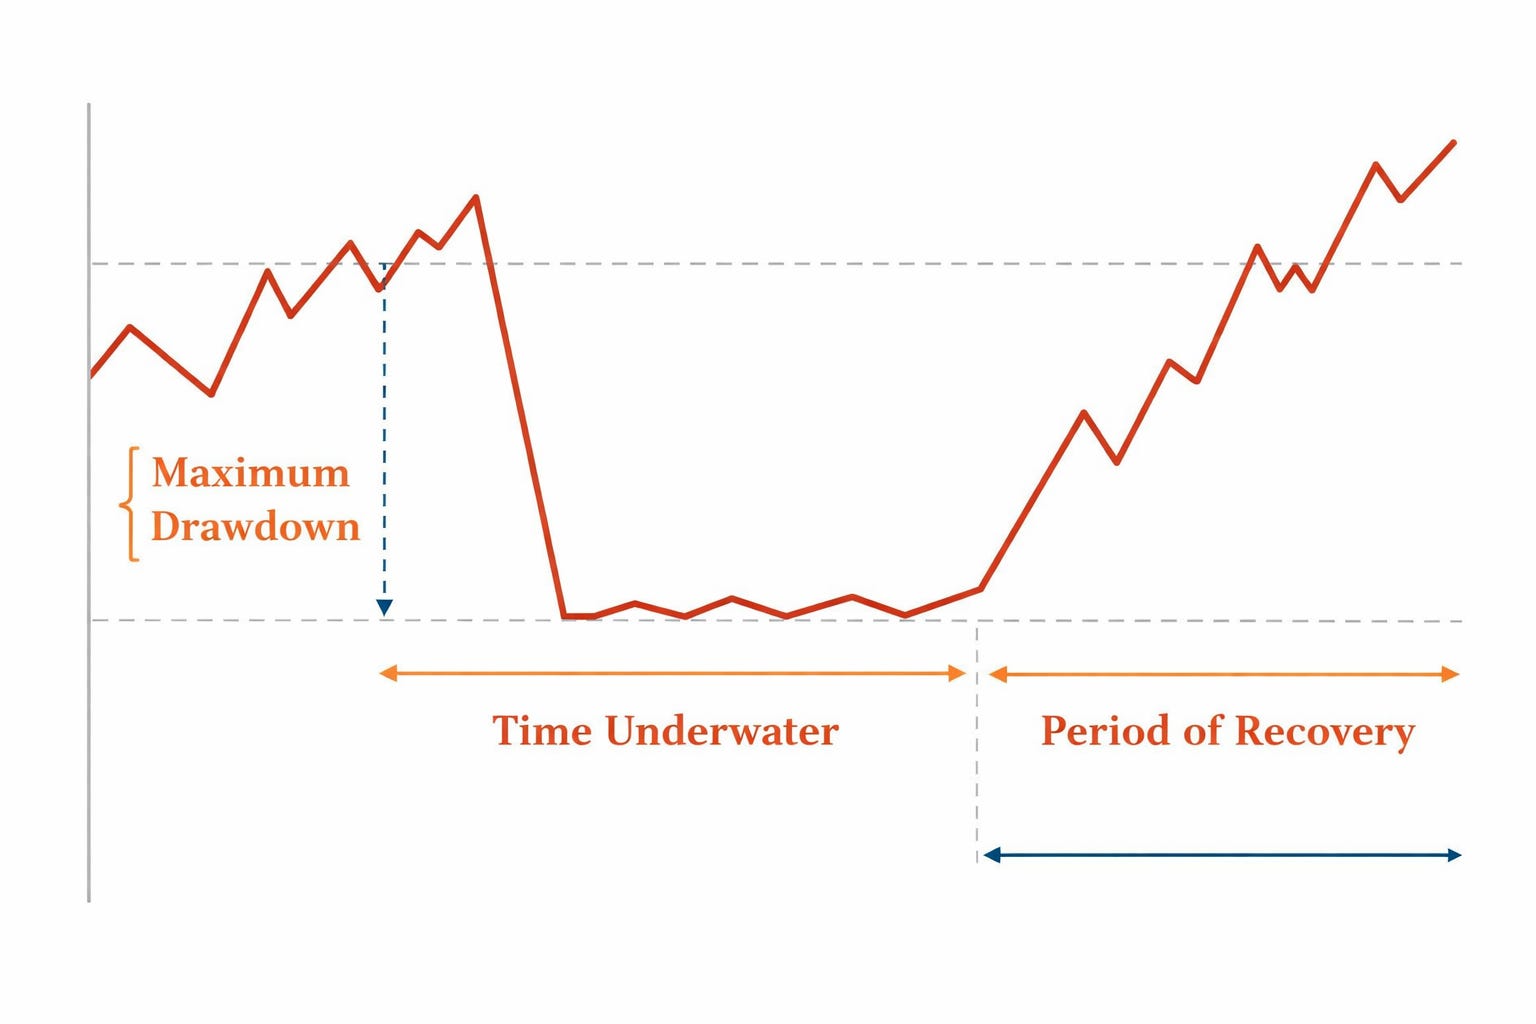
If you’re trying to outperform the market over the long term, how your portfolio behaves during market drawdowns matters far more than most investors realize. Large losses don’t just hurt psychologically — they permanently impair long-term compounding.
Here’s a striking illustration…
An Overlooked Factor to Berkshire’s Performance
Since 1965, Berkshire Hathaway has compounded its share price at roughly 20% annually, while the S&P 500 has returned about 10.4% over the same period. That difference may not sound dramatic at first, but over time it becomes enormous.
A dollar that compounds at 20% per year grows to roughly $56,348 over 60 years. The same dollar invested at 10.4% would be worth roughly $379 after 60 years.
What’s often overlooked is how Berkshire achieved this result. Since 1965, there have been 13 years in which the S&P 500 posted a negative return. Berkshire outperformed the index in 11 of those years. In total, Berkshire has beaten the S&P 500 in 40 of the past 60 years.
Buffett’s Partnership Days
Before Berkshire, when Warren Buffett was managing much smaller amounts of capital, the results were even more striking. From 1957 to 1968, the Buffett Partnership never had a down year — even as the Dow experienced four — and the Buffett Partnership compounded capital at 31.6% annually.
These results weren’t driven purely by superior stock selection or market timing. They were driven by portfolio construction, risk mitigation, and a deliberate focus on investments whose outcomes were not dictated by the market itself.
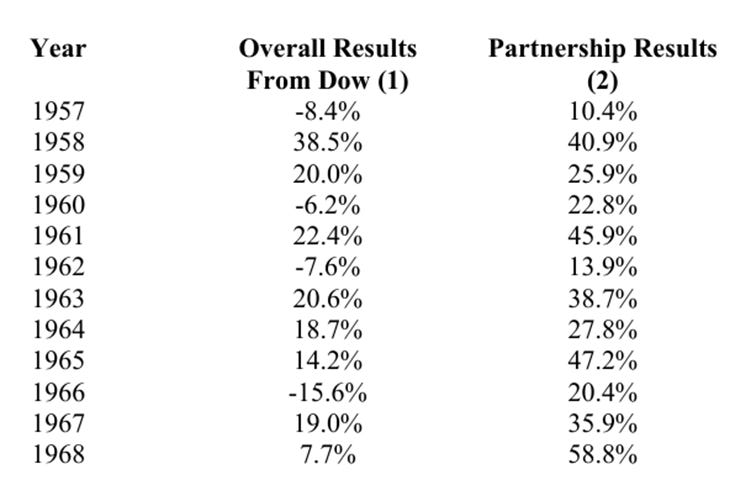
The Buffett Partnership looked nothing like the Dow, and a substantial portion of the capital was allocated to event-driven investments whose outcomes were largely independent of the broader market.
Here’s what really determines long-term wealth creation:
how deep your drawdowns are,
how often they occur,
and whether you’re forced to make bad decisions at the worst possible time.
Instead of asking, “how much can I make and how do I increase my returns?”, I ask myself, “what’s the worst-case downside risk and how much can I lose?”
These questions force me to think about how to manage those risks with the primary goal to always invest with a margin of safety.
How Large Drawdowns Affect Long-Term Compounding
Here’s an example of what the yearly performance might look like for two hypothetical value portfolios:
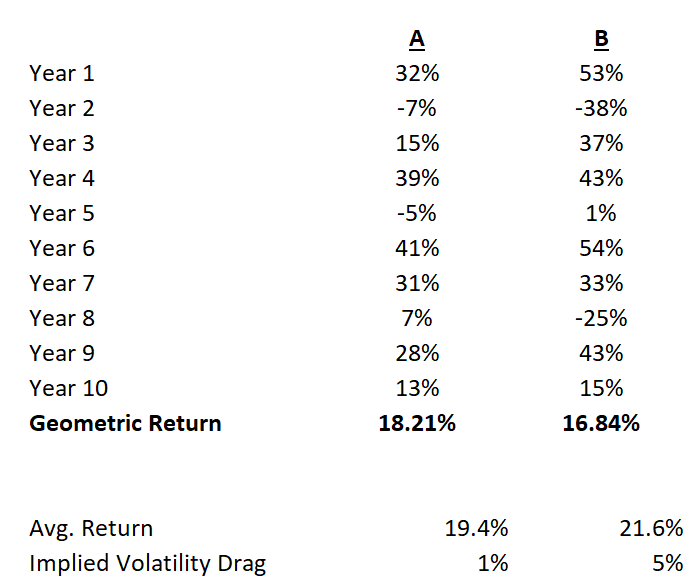
At first glance, Portfolio B might appear to be the better pick. It outperforms Portfolio A in 8 out of 10 years and posts a higher average annual rate of return.
However, Portfolio A produces a higher geometric rate of return — which is the true rate at which wealth compounds over time.
While Portfolio A underperforms Portfolio B in most individual years, it avoids the severe losses that dominate long-term outcomes. Portfolio B suffers two brutal drawdowns: –38% in Year 2 and –25% in Year 8. Those losses overwhelm its otherwise strong performance.
Portfolio A, by contrast, experiences far smaller drawdowns and has a lower implied beta, reflecting meaningfully lower dependence on overall market movements. The reduced volatility drag in Portfolio A — not higher average returns — is what ultimately allows it to compound wealth more effectively than Portfolio B.
Just as importantly, Portfolio A is far easier to live with. Smaller drawdowns reduce the likelihood of emotional decision-making, whereas the magnitude of Portfolio B’s two large drawdowns increases the risk that investors abandon the strategy at precisely the wrong time. In practice, the portfolio an investor can stick with is often the one that delivers the best long-term results.
This realization has fundamentally changed how I structure my portfolio.
Instead of trying to predict where markets will go next or pick the next best stock, I focus on reducing market dependence — while still targeting high long-term geometric returns.
That means intentionally lowering overall beta in the portfolio and replacing some traditional equity exposure with event-driven investments whose outcomes are less correlated to the market.
This article explains why I do this, what types of investments I use instead, and how this approach should offer solid rates of return while reducing large drawdown risk.
Why Asset Correlation and Beta Matters More than You Think
Beta is often dismissed as an academic metric. I disagree — though not for the usual reasons. I don’t view a higher-beta stock as inherently “riskier” simply because it’s more volatile. Instead, I think of beta as a measure of how closely an investment’s outcomes are tied to the broader market.
Another way to think about portfolio beta is asset correlation — how closely a portfolio’s returns move with the broader market. A lower-beta portfolio is typically less dependent on market direction, which is what matters most during major drawdowns.
In practice, beta is a proxy for something very real: how your portfolio behaves when markets are under stress.
For example, SPY is one of the largest and most widely followed ETFs tracking the S&P 500. It has a beta of close to 1 because its returns move almost perfectly in line with the overall stock market.
By contrast, Vanguard’s Core Bond ETF (VCRB) has a beta of roughly 0.15, meaning only a small portion of its price movements are correlated with the stock market. In practice, this implies that during significant equity market declines, a fund like VCRB would typically experience much smaller drawdowns.
While none of these figures are exact, broad beta ranges can be useful for thinking about portfolio construction and how different investment types tend to behave relative to the overall market.
Different Asset Types and Typical Beta Ranges
Generally speaking:
Large-cap and most publicly traded stocks:
~0.8 – 1.3
Most equities fall in this range. Some defensive stocks skew lower, while cyclical or highly leveraged companies often exceed 1. In aggregate, traditional stock portfolios remain strongly market driven.Bonds and fixed income:
~0.1 – 0.3
Returns are driven more by interest rates and credit risk than equity market movements, resulting in much lower correlation to stocks.Cash and U.S. Treasuries:
~0.0
Cash has no meaningful correlation to equity markets and serves primarily as a volatility dampener and source of optionality. Sometimes government bonds can have slightly negative betas during market shocks and flights to safety.Special situations (e.g., spinoffs):
Early / forced-selling phase: ~0.3 – 0.5
Later / fully seasoned phase: ~0.7 – 1.0
Early on, pricing is often driven by ownership changes and flow dynamics rather than fundamentals. Over time, as the market “figures out” the business, correlation to the market tends to rise.
Illiquid micro-caps and net-nets:
~0.1 – 0.5
Despite being perceived as risky, truly illiquid stocks often exhibit lower betas because they trade infrequently and are driven by company-specific factors rather than broad market flows.Event-driven investments (merger arbitrage, tender offers, liquidations, workouts):
~0.05 – 0.2
Returns are primarily tied to the resolution of a specific event, not market direction, which is why these strategies can meaningfully reduce portfolio-level beta when sized appropriately.
Being Thoughtful about Portfolio Construction
To be clear, I’m not arguing that the goal should be to minimize beta across an entire portfolio.
Rather, I think it’s prudent to be deliberate about how much of a portfolio’s performance is directly correlated to the direction of the overall market when constructing it.
And again, I should state that I disagree with the academic theory that a stock is inherently “riskier” simply because it has a higher beta. I’m just writing this to think about beta and asset correlation in the context of overall portfolio construction.
If your portfolio has a beta near 1, a 20% market drawdown probably means a 20% portfolio drawdown.
Avoiding a single –30% year can matter more than picking the next great stock.
This is why Buffett emphasized not losing money long before it became a cliché.
The Hidden Problem with Traditional “Long-only” Equity Portfolios
Even deep-value or quality portfolios tend to share the same flaw:
They are still fundamentally market driven and even deep-value portfolios can experience brutal drawdowns during periods of market stress.
When liquidity tightens:
correlations rise
multiples compress
and fundamentally unrelated businesses fall together
You can own great companies and still experience large drawdowns simply due to short-term market sentiment. That’s why I believe it’s prudent to allocate a portion of a portfolio to investments that are less correlated with the general stock market.
So, what types of investments don’t care as much about where the S&P 500 goes?
Event-Driven Investing: Returns with Different Drivers
The core shift in my portfolio has been toward event-driven investments — situations where the outcome depends on a specific event, not general market sentiment.
These include:
1. Workouts & special situations
Examples:
tender offers
merger arbitrage
liquidations
rights offerings
These investments are typically:
time-bound,
contractual or structural in nature,
and far less sensitive to market moves.
Returns come from resolution of a corporate event, not general market sentiment.
2. Spinoffs and forced selling situations
Spinoffs often trade irrationally at first because:
index funds are forced sellers,
legacy shareholders don’t want the new company,
Early on, pricing is driven by flows, not fundamentals.
That’s why spinoffs can behave more like workouts than equities — at least initially.
3. Illiquid micro-caps and net-nets
Illiquid micro-caps are often:
ignored by institutions,
thinly traded,
and anchored by asset value rather than earnings multiples.
Ironically, illiquidity can reduce market correlation because:
there are fewer forced sellers,
prices don’t gap down instantly during panics.
smaller stocks sometimes have higher insider ownership and a more stable shareholder base who won’t dump their stock during a market panic
These aren’t risk-free — but the risk is different.
Many academics equate beta with risk, and by extension assume that illiquid micro-caps are inherently dangerous.
Ironically, less liquid micro-caps often exhibit much lower betas than the overall market, because their prices are driven more by company-specific factors than broad market movements.
4. Selective high-yield bonds
When you buy distressed debt or other types of high-yield bonds correctly:
recovery rates and the yield to maturity matter more than the market
capital structure outranks sentiment,
and outcomes are often asymmetric.
Done carefully, this sleeve can add return without adding much beta. When done right, bond investing can offer equity like returns with lower downside and volatility than typical equities.
What My Portfolio Looks Like Today
Rather than a traditional equity allocation, my portfolio is structured across multiple return engines:
a few deeply mispriced “general stocks” – these would include companies such as Forrester Research (FORR), which I bought at around 3.8x cash-adjusted P/E and the company has nearly 70% of the market cap in net cash
a meaningful workout / event-driven sleeve – I just wrote a piece on Unit Corp, which I believe is in a slow liquidation and half their market cap is in net cash.
exposure to spinoffs and illiquid micro-caps - I have a large position in Versant Media Group, which owns CNBC and The Golf Channel. Comcast just spun off Versant and the shares started trading early last week. I also have small positions in stocks such as IEH Corp., Forge Group, and QEP.
selective distressed credit and high-yield bonds
and a meaningful cash buffer
The goal isn’t to eliminate volatility — it’s to eliminate ruin.
In an average bear market where indexes fall ~20%, I’d expect a portfolio like this to be down closer to ~10%, not 20%.
I estimate my current portfolio has a beta of around 0.47. A typical portfolio of stock and bond funds might have a portfolio beta around 0.65. A typical common stock portfolio likely has a beta around 1.
Here’s a rough breakdown of how I’m currently invested and how I would structure a portfolio if I was trying to mitigate major drawdown risk:
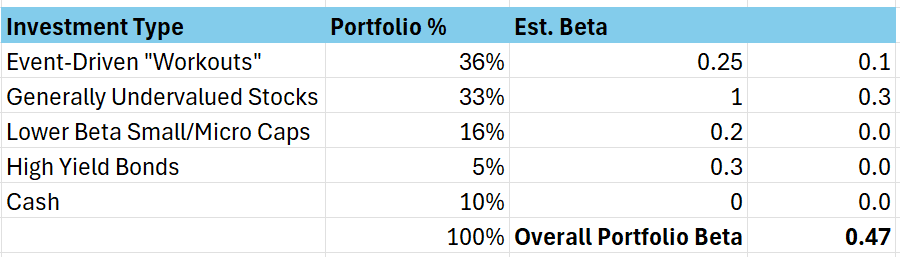
I should also emphasize that I am not reducing projected returns with this approach. I estimate that the overall earnings yield on my portfolio is roughly 19.5%. This includes the earnings yield on common stocks, dividends/interest payments and projected rates of returns on event-driven situations. I’m also not taking on huge amounts of risk in each position. Most of the stocks I invest in have low amounts of debt, high cash balances and high free cash flow or “owner’s earnings” yields. Moreover, I only invest in event-driven investment opportunities where the risk of permanent capital loss is very low.
By earnings yield, I am referring to “owner’s earnings” divided by the enterprise value. Owner’s earnings is a rough proxy for free cash flow (with a few adjustments) and is equal to net income + depreciation & amortization - maintenance capital expenditures (CapEx) +/- changes in working capital.
“…we can gain some insights about what may be called "owner earnings." These represent (a) reported earnings plus (b) depreciation, depletion, amortization, and certain other non-cash charges such as Company N's items (1) and (4) less (c) the average annual amount of capitalized expenditures for plant and equipment, etc. that the business requires to fully maintain its long-term competitive position and its unit volume. (If the business requires additional working capital to maintain its competitive position and unit volume, the increment also should be included in ( c).”
- Berkshire Hathaway 1986 Annual Letter to Shareholders
How This Compares to the Buffett Partnership
Early Buffett didn’t just buy stocks and wait.
He explicitly divided capital into:
Generals (long ideas),
Workouts (event-driven situations),
Cash, when opportunities were scarce.
In the 1968 letter, Buffett reported that the partnership was nearly 40% in cash and workouts. This was right before Buffett shut down the partnership when markets were high.
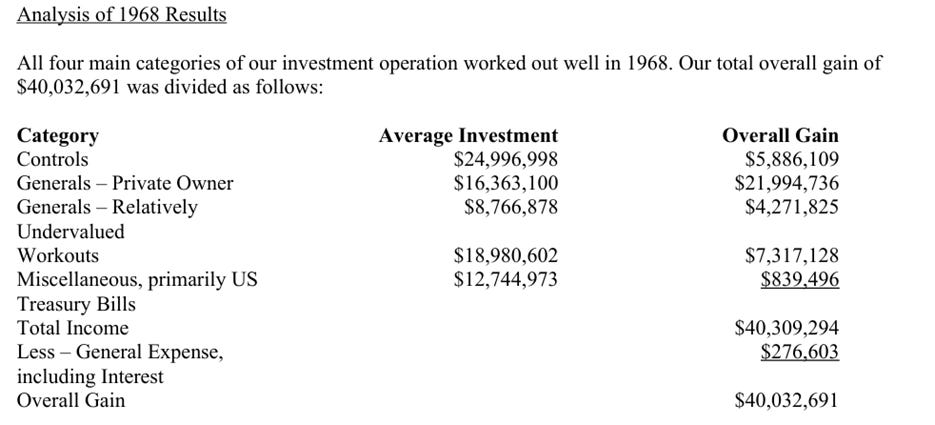
“Controls” made up about 30% of the portfolio and only about 30% of the portfolio was really exposed to the broad equity markets. Buffett would scale up or down the percentage of generally undervalued securities based on the market levels. The partnership would have a higher mix of cash and workouts when the market was at elevated valuation levels and a higher mix of generally undervalued securities when the markets were undervalued.
As capital grew and markets became more efficient, the mix changed — but the principle stayed the same:
Don’t let the market dictate your outcomes.
I’m not claiming to replicate Buffett’s returns — I just try to put into practice successful investing principles that have been proven to work by those who have come before me.
While not explicitly stated, based on the various portfolio structures in the Buffett Partnership years, the portfolio beta was likely anywhere from 0.3 – 0.6. That’s much different than today’s traditional stock portfolios which often have betas near 1.
Why this Approach Improves Long-Term Compounding
Lower market correlation does three critical things:
Reduces drawdowns
Improves decision-making under stress
Raises geometric returns even if arithmetic returns are similar
This is counterintuitive but mathematically unavoidable.
Compounding favors:
steadier paths
fewer catastrophic years
and capital that stays intact long enough to exploit opportunity.
Important caveats
This approach is not:
passive
scalable to billions
or appropriate for everyone
It requires:
patience
comfort with some illiquidity
willingness to look wrong in the short-term
and constant sourcing of opportunities.
Event-driven investing is a process, not a stock list.
Closing thoughts
I’m not trying to predict the next market crash.
I’m trying to build a portfolio that doesn’t require me to.
By shifting some capital away from market-dependent assets and toward event-driven situations, I’m aiming for:
lower beta,
smaller drawdowns,
and better long-term compounding.
That trade-off is worth it to me.
https://companycharts.substack.com/p/12-microcaps-trading-below-net-cash?r=6kpr46
Don't think any of these are liquidating but are interesting just due to the nature of the market cap being less than Net Cash.